CompMath: Vorlesung 9.10.2020
Weltrekordentwicklung/Bestzeiten 100m der Maenner und der Frauen, ab 1960 Historische Daten aus der Wikipedia mit Jahresweltbestleistungen im http://www.all-athletics.com/de/top-lists.
Contents
clear, clc, clf % Beginne mit leerem Workspace, leerer Console und leerer Grafik

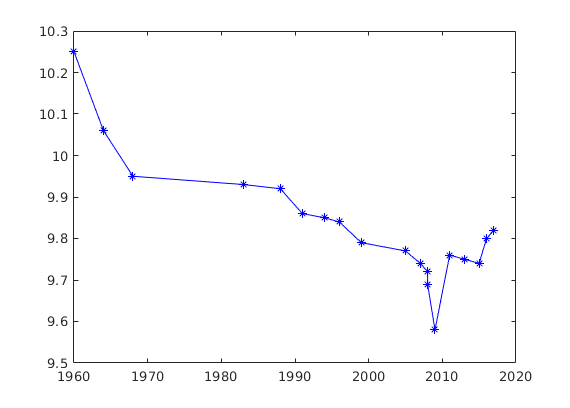
Maenner
jahr = [1960  1964  1968  1983  1988 1991 1994 1996 1999 2005 2007 2008 2008 2009 2011 2013 2015 2016 2017];
zeit = [10.25 10.06 9.95  9.93  9.92 9.86 9.85 9.84 9.79 9.77 9.74 9.72 9.69 9.58 9.76, 9.75 9.74 9.80 9.82];

%
plot(jahr,zeit,'-b*')
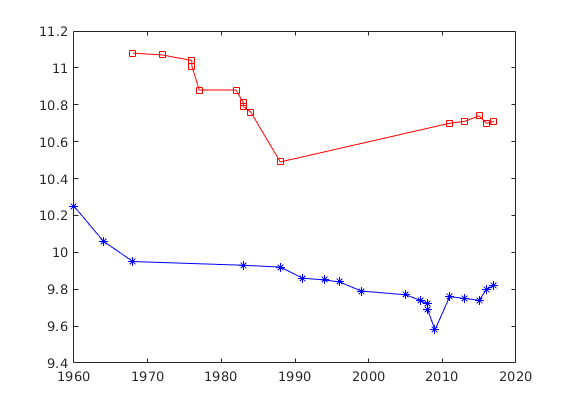
Frauen
jahr_w = [1968,  1972,  1976,  1976,  1977,  1982,  1983,  1983,  1984,  1988,  2011   2013 2015 2016 2017];
zeit_w = [11.08, 11.07, 11.04, 11.01, 10.88, 10.88, 10.81, 10.79, 10.76, 10.49, 10.70, 10.71 10.74 10.70 10.71];

hold on                       % Zeichne in das gleiche Grafikfenster wie voriger plot
plot(jahr_w,zeit_w,'-rs')

%plot(jahr,zeit,'-b*',jahr_w,zeit_w,'-rs')  % Beide Plots in einem Befehl
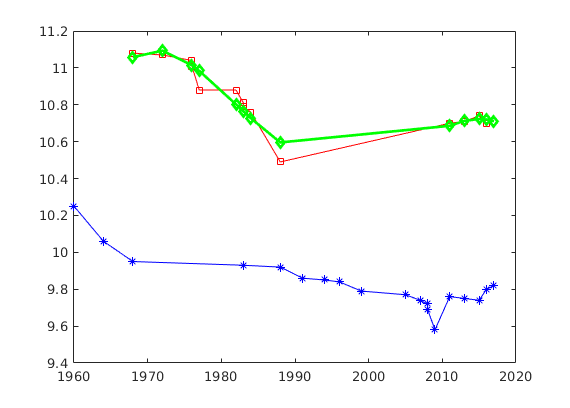
polynomial fitting (nur zur Demonstration)
degree = 4;                              % Polynomgrad
poly = polyfit(jahr_w,zeit_w,degree);    % berechne Polynomkoeffizienten
% jahr_w = 1968:2:2030;                  % Jahreszahlen über Gültigkeitsbereich hinaus
pz_w = polyval(poly,jahr_w);             % berechne Werte des Polynoms in Abhaengigkeit von jahr_w
plot(jahr_w,pz_w,'-gd','LineWidth',2)
Warning: Polynomial is badly conditioned. Add points with distinct X values,
reduce the degree of the polynomial, or try centering and scaling as described
in HELP POLYFIT.
Plot beschriften
xlabel('Jahr')
ylabel('sec.')
title('Weltrekord-/Bestzeitenentwicklung ueber 100m')
legend('Maenner','Frauen','Approximation')  % Beschriftung
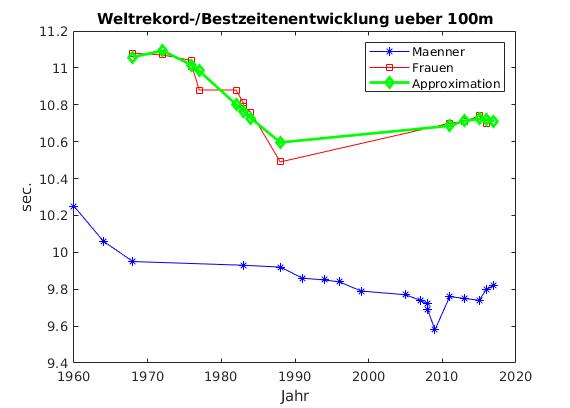
Speichern des Bildes
saveas(gcf,'v_1a.jpg')                      % Speichern des Bildes

% publish('v_1a.m')                      % Erzeuge html des Skriptes mit allen Ausgaben
